Forum Replies Created
-
1 August 2020 at 9:29 pm #247
Hi,
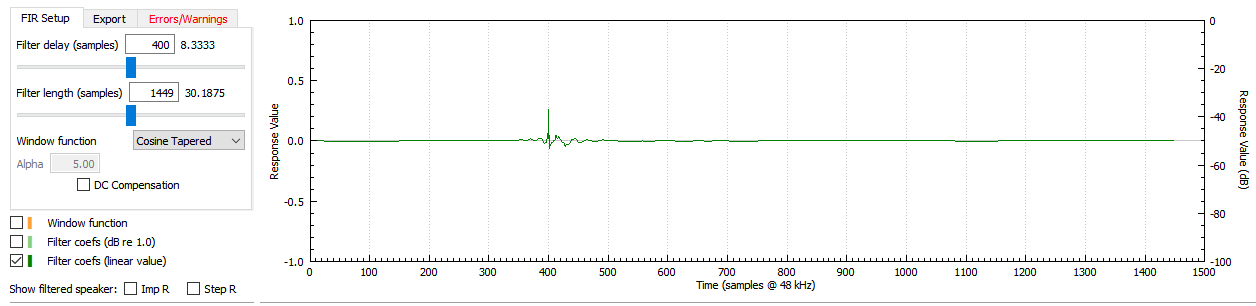
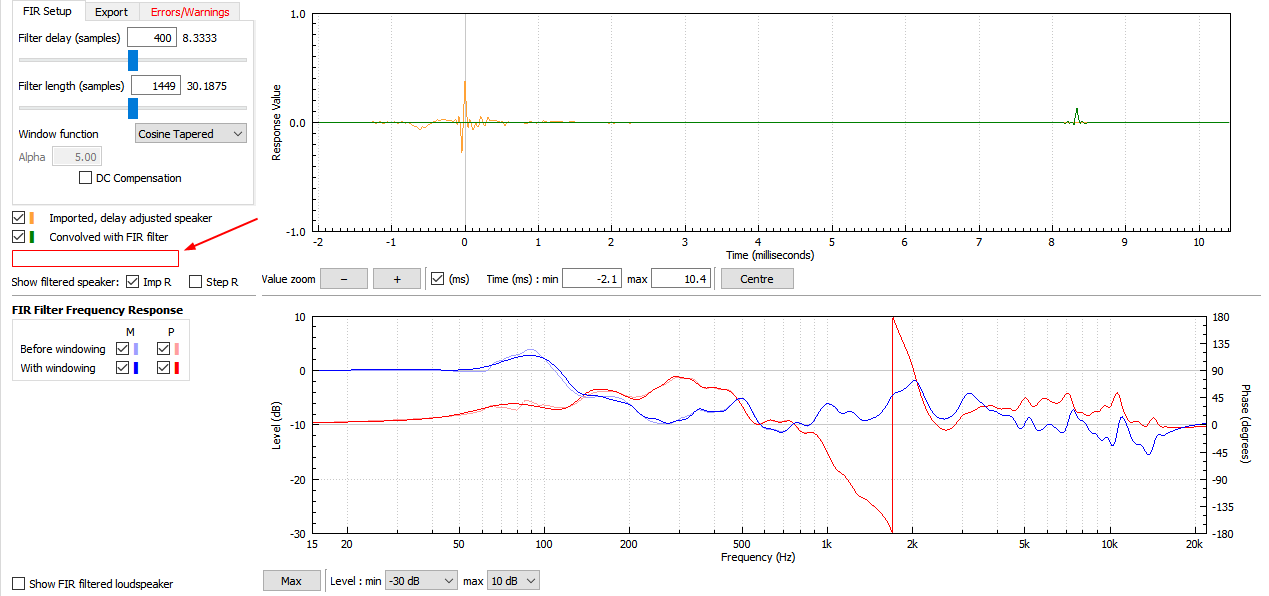
I only see the magnitude and phase response of the EQ filter, not its IR response. Perhaps you can add it as the toggle box below the “Convolved with FIR filter” option as shown by the arrow below.
-
This reply was modified 5 years, 10 months ago by
 EA Support.
14 July 2020 at 11:15 pm #224Hi,
Thanks for the feedback.
I have done some reading on the (RTF EQ) topic recently, although I get lost sometimes with the heavy maths in some of those articles. To that end, the request I submitted for variable smoothing feature comes from the recommendation made in quite a few journals about perceptually-motivated, magnitude response smoothing as one of the pre-processing techniques for DSP, especially when doing room EQ.
12 July 2020 at 10:01 pm #200Hi,
I think a graph color option for the top graphs within the IIR Filters tab all the way to the FIR Voicing tab (including shade toggling) would be super. Can you also please consider a more granular zoom funtion for the Impulse Response graph? Sometimes when zooming the IR peaks jump out of the graphing legend. A more fine grained control would be appreciated.
-
This reply was modified 5 years, 11 months ago by EA Support.
11 July 2020 at 11:37 pm #198Hi,
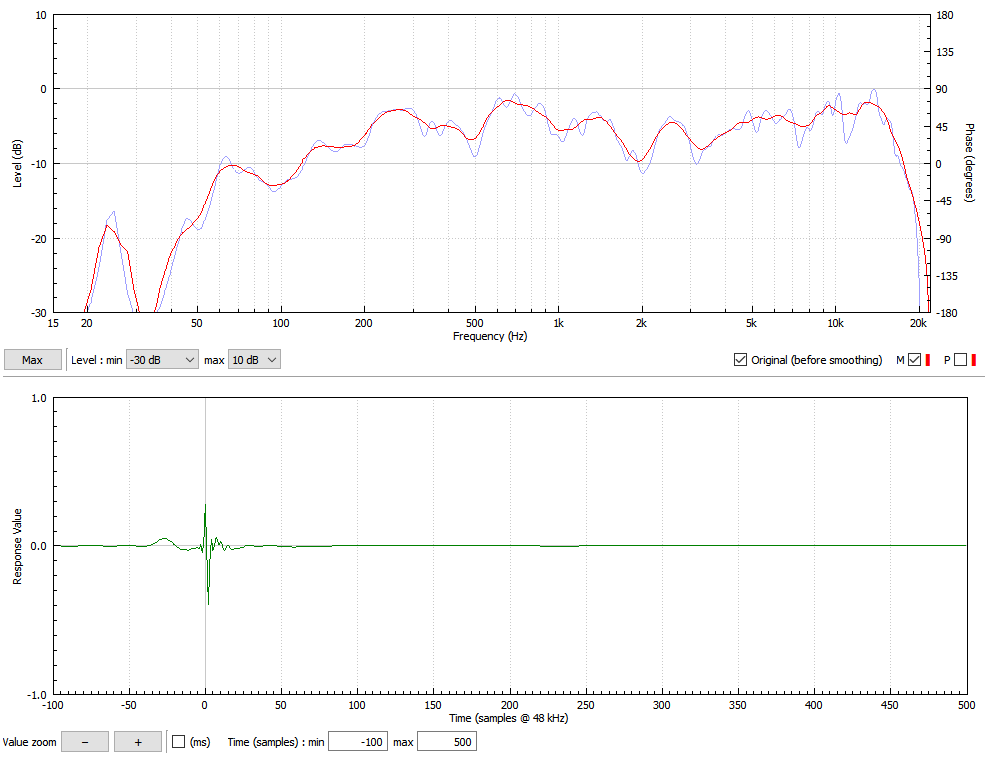
Can you be so kind as to consider adding the graph color option in the Import tab for both the magnitude and the impulse response graphs?
I was doing a basic comparison of a power-smoothed graph vs an unsmoothed one and could only change the color of the processed graph and not the original one if the “Original (before smoothing)” option is turned on. The “Original (before smoothing)” option for the Impulse Response would be nice as well since it is also affected by the smoothing operation. It will allow one to be a bit more granular in doing a comparative analysis of the smoothing operation.
-
This reply was modified 5 years, 11 months ago by EA Support.
11 July 2020 at 9:48 pm #196Hi,
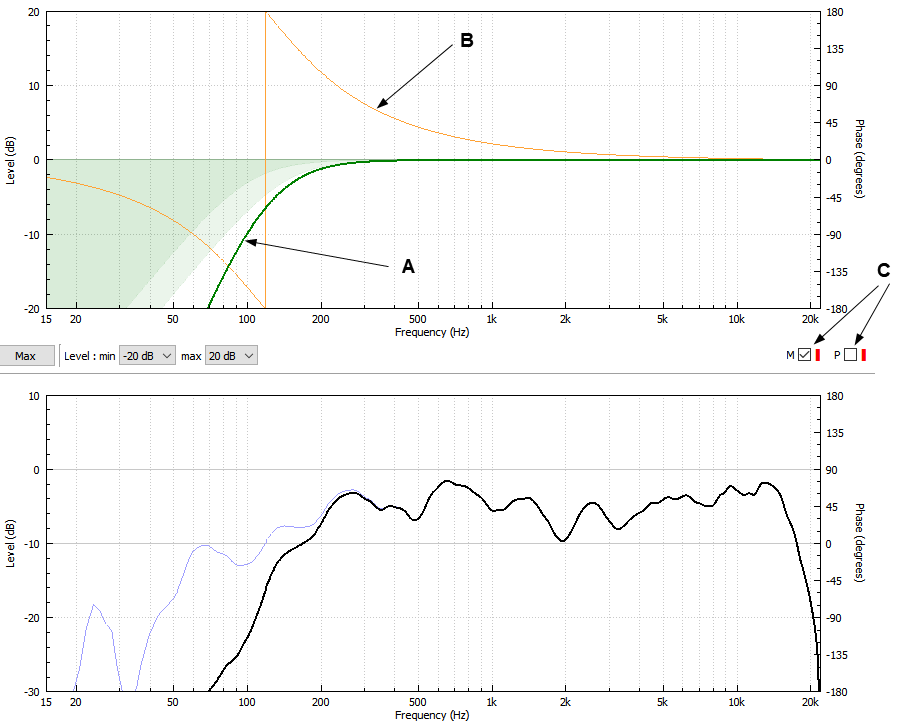
Further to the feature request to be able to toggle off/on the shaded area on the filter graph within the “IIR Filters” tab. It would be great if we can also have Magnitude and Phase toggle boxes (C, which I copied into the screenshot to make it easier to visualise), for the filter graph that will allow one to see just the filter magnitude (A) or the phase (B) responses.
-
This reply was modified 5 years, 11 months ago by
musan.
-
This reply was modified 5 years, 11 months ago by EA Support.
10 July 2020 at 2:51 am #194Hmmm, I see the picture is not being displayed. Can you check if you can see it on your side? It is at this URL https://postimg.cc/kRFm9JXG
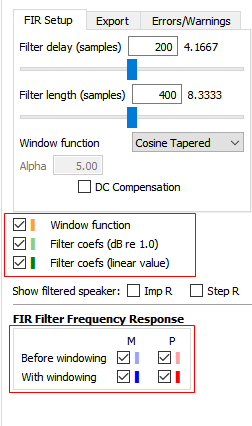
7 July 2020 at 8:35 pm #191Hi,
Under the same Tab, I also noticed that I cannot change the graph colors for fields encircled by the rectangles.
-
This reply was modified 5 years, 11 months ago by EA Support.
-
This reply was modified 5 years, 10 months ago by
-
|