Forum Replies Created
-
4 October 2023 at 6:47 am #716
I have latest versions of both products installed on Windows 11, FIR Designer M is a demo version. The issue exists even without loading any project files. JUst open FIR Phase Adjust tab and select any of the all-pass filter prototypes, then drag the gray pointer that appears in the graph area on the upper right window. The speed that the dragged pointer moves is much faster in FIR Designer M than in FIR Designer. I noticed this behaviour even with last versions of both softwares. I will email the project for youre reference.
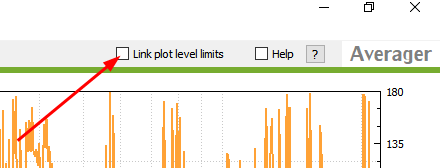
22 August 2022 at 1:49 am #537I figured it out, I used Save option of the Averaging Session File in the Load and Setup Tab. Saving in the Load and Setup feels counterintuitive though as it pertains to the workflow. One would expect the Save/Save as buttons should be in the Average Tab at least because this is where the core of the Measurement Averaging functions reside.
11 July 2022 at 1:00 am #512Please also consider adding an option to adjust the “Apply common delay” in both time and samples like it is in Averager
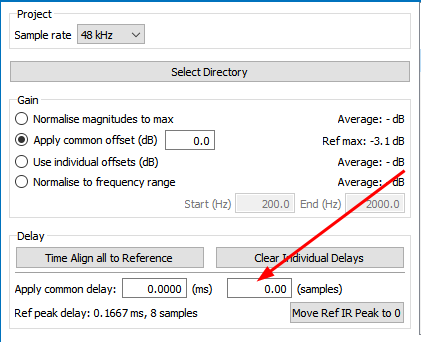
This could be extended to the Import tab where the only option currently available is adjusting the delay in samples.-
This reply was modified 3 years, 11 months ago by
musan.
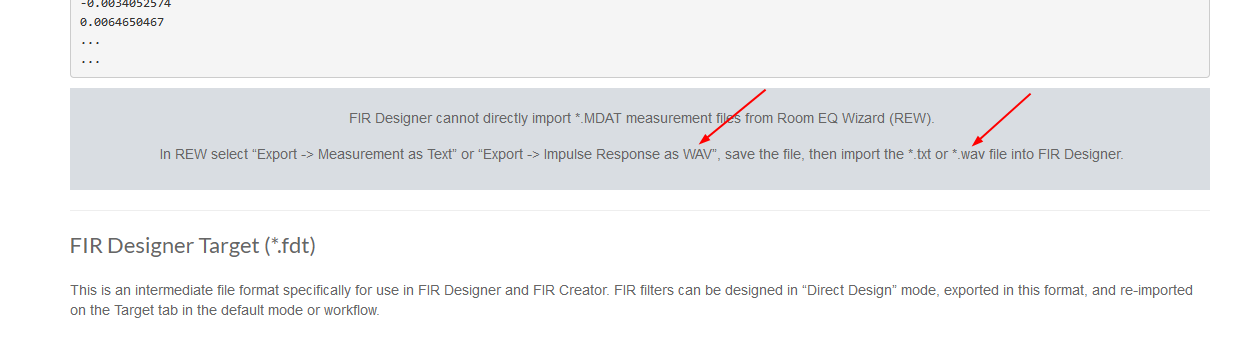
4 July 2022 at 10:20 pm #508I know exporting tne measurement as IR works without issues. I was hoping to take advantage of the varable smoothing offered by REW when exporting as txt. I can still use variable smoothing in auto mag adjust but it involves extra steps I was trying to avoid. It will be better when variable smoothing becomes avaialble in FIR Designer
2 October 2021 at 7:55 pm #357Hello,
We do provide fractional octave based frequency smoothing at measurement import. And in the “Auto Mag” and “Auto Phase” FIR tabs, there is the ability to use different fractional octave frequency smoothing in different frequency regions.
I remember asking about the variable frequency smoothing option in the Import tab a while back. I hope you can still consider adding it as it can save a few steps when working in the Auto Mag and Auto Phase tabs.
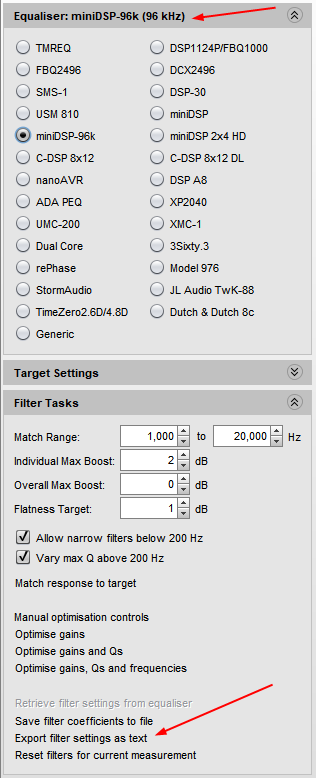
7 December 2020 at 11:15 pm #304Thanks for considering this. I guess this would work well for the DSP processors/software already supported by REW as one only needs to “Export filter settings as text” like shown below. For additional processors then yes, there might be more work involved to get them supported (at least for the IIR mode).
 30 November 2020 at 11:41 pm #291
Yes, the TXT IRs work without issues. Perhaps then you may want to highlight the issue with .wav in the URL you reference as it is still showing .wav as one of the preferred methods to import IRs from REW into FIR Designer.
https://i.postimg.cc/mgrZfBPn/Snap1.png -
This reply was modified 3 years, 11 months ago by
-
|